Peak performance
May 21, 2023
An interesting question
A couple of months ago I got a message from a friend:
Hey, a friend of mine is looking for all the peaks in Hungary, no matter how tall or short they are. He’s not satisfied with the ones available on OpenStreetMap.
Well, this was a problem because I usually go to OSM as a first step when thinking about geographic problems. Getting all Hungarian peaks that are in the OSM database is trivial, for example, by searching for natural=peak nodes in Overpass Turbo. Read more about the OSM data model here to understand what nodes are. For the specific natural=peak tag, check this page. Or, for a detailed tutorial on Overpass Turbo, check out my earlier post. However, since OSM is a community project with data added by volunteers, we cannot expect this list to be exhaustive or 100% accurate, even for the peaks that are in the database.
My overly ambitious and overconfident answer was this:
Well, if you’re not happy with what’s already in OSM, you could just grab some SRTM The Shuttle Radar Topography Mission (SRTM) data is a freely available near-global Digital Elevation Model (DEM), containing the elevation above sea level for most places on Earth. A good site to download it from is this one. data, define what a peak is, do some GIS The acronym literally stands for Geographic Information System but can be used to refer to any analysis of geographic data. magic, and bam, you’ve got your peaks.
Trying to implement “some GIS magic”
While the points I made were correct, implementing them proved to be more challenging than I had anticipated.
The simplest definition of a peak could be “any point where all adjacent points are at a lower elevation”. This is easy to calculate, but does not feel right. Is a tiny bump of, say, 0.25 meters on a mountain ridge really a peak? It felt like this example would not be significant enough to be called so.
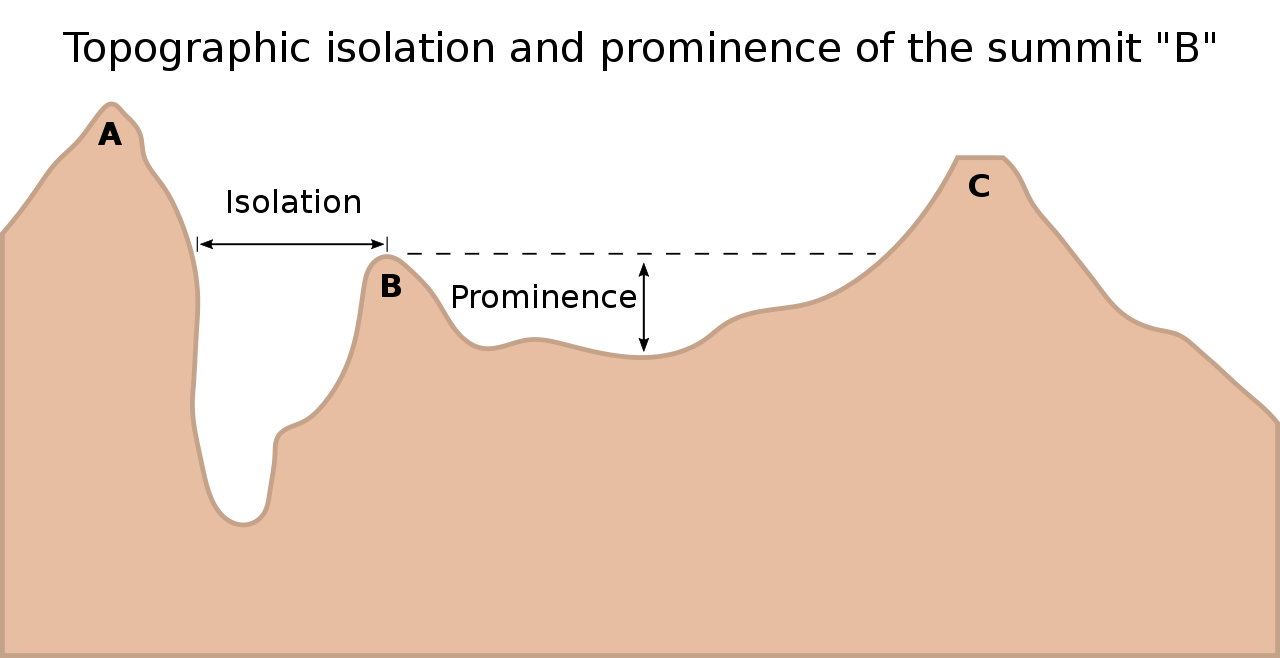
Therefore, I set out to understand the definition of a peak. Fortunately, I quickly found the Wikipedia article discussing topographic prominence and topographic isolation. The first of these two articles is a lot richer (with very detailed explanations and examples), I recommend checking out that one. It turns out that there are two important characteristics of peaks, apart from the well-known measure of elevation above sea level (definitions taken from the corresponding Wikipedia articles):
- Topographic prominence measures the height of a mountain or hill’s summit relative to the lowest contour line encircling it but containing no higher summit within it. It is a measure of the independence of a summit.
- Topographic isolation is the minimum distance to a point of equal elevation from a given summit.
While these are not trivial to understand at first glance, the figure provided in the articles clarifies the definitions:
Okay, so I have the data and definitions, time for the aforementioned GIS magic: find all potential peaks (points that are higher than their neighbors), calculate their prominence and isolation, and find some thresholds above which a point can be called a peak.
And this is where I got stuck. I quickly realized that if I didn’t come up with a smart algorithm, I would essentially be comparing every point in the world to every point in the world, which is an impossibly large task. I thought about first identifying peaks by finding points where all neighboring points have a lower elevation, then combining this with contour lines that I can generate from the SRTM data, SRTM data comes in a raster format, which means that the surface of the Earth is divided into small areas, and we know the elevation in those areas. Contour lines are vector-based: they are looped lines that connect adjacent points that have the same elevation. These can be described as mathematical equations instead of just coordinates and an elevation. This makes it easy to perform operations such as determining whether or not a point is inside a contour. For more information on vector and raster data, see Chapter 3 and Chapter 6 of “A Gentle Introduction to GIS”. but this would only have helped to find the prominence of the peaks. Isolation still requires a wide (computationally expensive) search. I am not a computer scientist, so I decided to look a bit further, hoping that someone already has a solution for this.
A solved problem
As it turns out, other people have indeed pondered this problem before me. I quickly found Andrew Kirmse’s website which has a detailed and fascinating guide on calculating prominence and isolation efficiently as well as a journal article covering this topic. Unlike me, Andrew isn’t just some random guy on the internet; he was behind the creation of Google Maps and Google Earth among many other projects. He even shared a dataset with close to 12 million peaks in it. Unfortunately, since his dataset is limited to peaks with a prominence of at least 300 feet, it does not cover all the little humps in Hungary that my friend’s friend was after.
In their preprint paper, Andrew and Jonathan de Ferranti point out an important limitation of using SRTM data for the analysis of peaks: it is just not granular enough. As they state: “because DEMs represent the average elevation values in each of their samples, they tend to underestimate summit elevations, sometimes significantly”. This is something I’ve seen many times when out hiking: my digital map (created using SRTM data) shows only a few meters of elevation to conquer, while in reality there is a significant peak that is simply not shown in the contour lines.
At this point, I decided that I would not actually try to identify peaks. The data is not granular enough and the calculations would be computationally expensive. I told my friend that I could not reasonably get a better list of peaks than what is already in OSM.
How are mountains named?
While researching this topic, I had an idea for an interesting project: let’s try to understand the why certain geological formations have the names they have. Why is an elevated point called a mountain, a hill, a peak, a rock, or something else? For example, in the OSM list of peaks, there are several Hungarian elevated places that are called a mountain, while their elevation is less than 200 meters above sea level – but there is a “hill” that is 778 meters tall.
I thought about getting the list published by Krimse and de Ferranti, finding the name of the peak in OSM, and then running a classification algorithm where elevation, isolation, and prominence are the explanatory variables and the peak type is the outcome variable. Then, I could understand how peaks are named – and probably identify some misnamed ones that should be called a hill instead of a mountain, for example.
I soon found out that once again I am not the first person to have this idea. Steph Abegg did almost exactly this I would have looked at peaks in Hungary, but otherwise her approach is very similar to what I had in mind. Excerpt from her abstract: “Why is it Mount Baker and Mount Rainier, and not Baker Mountain or Rainier Peak? Are Peaks really peakier and Mounts more massive, or do summit titles follow too much whim and misnaming for any significant relationships to exist?” in 2010 when looking at peaks, mounts, and mountains in the state of Washington in the US. I really recommend reading not only the summary on the website, but also the attached report.
Potential extensions to the existing research
While the above paper covers much of what I had in mind, there are still avenues to explore in understanding naming conventions:
- The paper uses a multinomial logit regression, where the explanatory variables are combined in a linear fashion. It would be interesting to see a tree-based approach to the prediction that allows for a more “what-if” approach to naming. For example, we could get the following rule: “an elevated point is a hill if it is shorter than 500 meters; if it is higher, it is a mountain if its prominence is less than 200 meters, and a peak otherwise”.
- There are some names that suggest that there are other variables that contribute to the naming algorithm.
- For example, there is a peak called Köpüs-tető in the Bükk Mountains in Hungary. Tető means top, and the name implies (at least to me) a somewhat flat peak. Pointiness or flatness is not directly accounted for by using prominence and isolation, although there is some information in these variables.

Pengő-kő (literally: Ringing Rock) in the Zemplén mountains in Hungary. Today, it is covered in forests with no views, but as this photo from the 50s shows, this was not always the case. This could be the reason why it is called a “rock”. Photo CC-BY-SA Fortepan / Kurutz Márton Some peaks could be covered by vegetation, while others may not. For example, one would expect a peak called Something Rock to have a visible rock surface.
- It would be interesting to see if different cultures have different naming patterns. While the original paper discusses expanding the analysis to other states, countries with different languages are not mentioned.
- For example, both mount and mountain are typically translated to hegy in Hungarian. Could we suggest another translation (to an existing word) based on looking at and comparing the characteristics of mounts and mountains to peaks that have proper Hungarian names?
- In the Spanish-speaking world, peak names do not typically have a “peak type” component. How do we take this into account?
Where are my peaks then?
As mentioned previously, I’d first look at OpenStreetMap data. It might be good enough for the purpose. The easiest way to get something more “official” is to buy a real paper hiking map of the area you want to explore. These are usually of a much higher quality than online maps, although there is no guarantee that they will show more peaks.
Another way to find peaks is to look at orienteering maps of the area. Orienteering is a sport in which (very simply put) you have to find a series of checkpoints in a given order in a given area in the shortest amount of time. It typically involves running or fast walking over varied terrain - hills, valleys, ditches, rocks; open areas and forests are typically present. Since you need to be able to plan your route very carefully, tournaments use highly detailed maps, much more detailed than the usual outdoor maps.
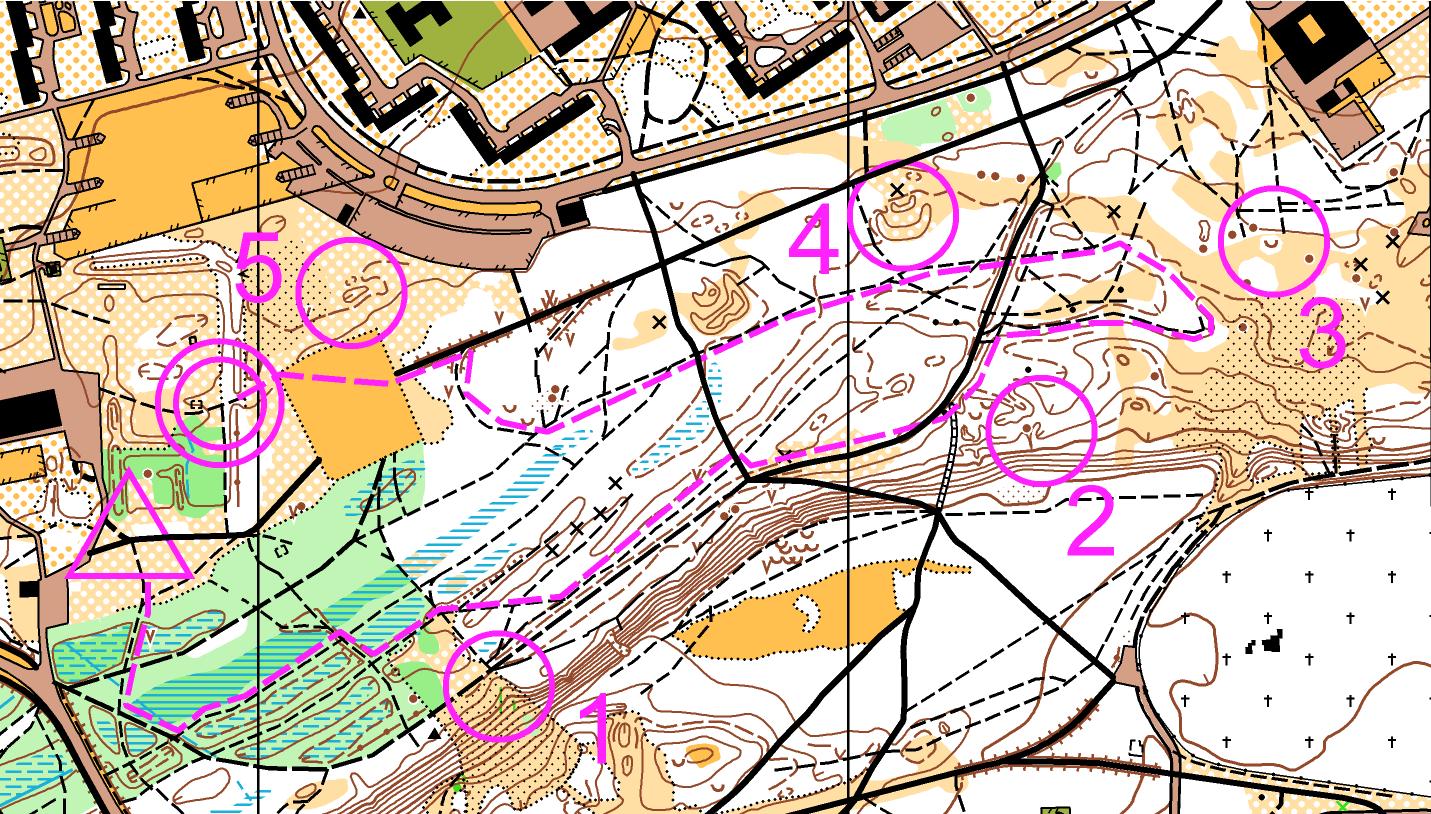
These maps are not easy to come by, as they require a tremendous amount of effort to create. While LiDAR-equipped drones can help a lot with the topography of the area, most features still need to be recorded by humans. Additionally, orienteering maps have no labels on them, so it is probably a good idea to keep a less detailed but labelled map at hand. However, if such a map is available, it is a good idea to use it.
A third option is to use military maps. While not as detailed as orienteering maps, they may be available for the entire country, and I’ve found that they have quite a few peaks marked – even if not all the tiny ones. For Hungary, see military maps e.g. in this shop.
❧
Cover photo: View from Prédikálószék on April 13, 2023. Photo by the Author, 2023. Creative Commons CC BY-NC-SA 4.0