How far up does the tram go?
November 25, 2013
Historically, there were three relatively hilly tram lines in Budapest: 58, 59, and 61. Service on line 58 has been suspended since 1977. In this case, “suspension” includes the tracks having been removed and paved over. Based on this, I do not think service will restart anytime soon. But how far up do these actually go? And which one is the steepest?
Interestingly, all of these lines go through Széll Kálmán square (previously known as Moscow square), so we can plot their elevation profile starting at the same spot.
I did not include the cog-weel railway, as it has a much steeper incline (for which the cog wheels are needed); I only focused on regular trams.

You can explore these lines on a map (and download the data if you wish) here.
I created this chart using Garmin Basecamp with maps from OpenMaps.eu. Since I knew where the trams run, I just drew a track along their route and created the elevation profile. After this I merged the profiles onto each other using Inkscape.
In the case of this project, I still think that the manual solution is the easiest. If I were to do this programmatically, I would do the following (using Python as a wrapper):
- Query Openstreetmap for tram relations (see this post for some details)
- Add elevation data using the MapQuest API
- Come up with some logic to transform the data – for example, move all elevation profiles to start from the same point and put the lower end to the beginning of the profile
- Use ggplot to visualize the elevation profiles
A previous version of this article originally appeared on transporteconomics.hu, a transportation-focused personal blog I do not update anymore.
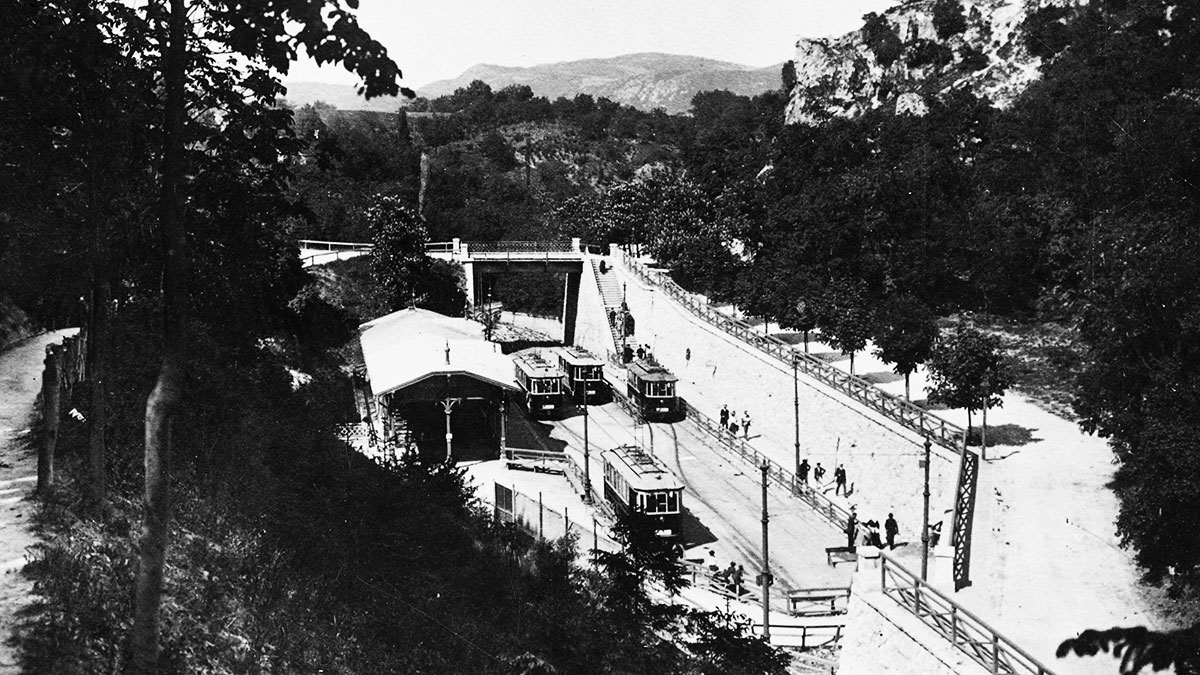
Cover photo: FORTEPAN / MAGYAR RENDŐR. Creative Commons CC-BY-SA-3.0